About the Curves dialog box
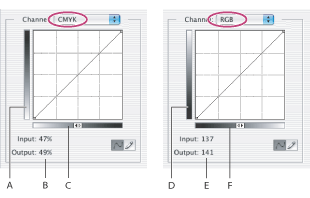
The Curves dialog box opens with the curve as a straight diagonal line. The horizontal axis of the graph represents the original intensity values of the pixels (Input levels); the vertical axis represents the new color values (Output levels).
By default, Curves displays the intensity values from 0 to 255 for RGB images with black (0) at the bottom left corner. By default, Curves displays percentages from 0 to 100 for CMYK images with highlights (0%) at the bottom left corner. To reverse the display of intensity values and percentages, click the double arrow ![]() below the curve. For RGB images, 0 will now be at the bottom right corner and for CMYK images, 0% will be at the bottom right corner.
below the curve. For RGB images, 0 will now be at the bottom right corner and for CMYK images, 0% will be at the bottom right corner.

Default curve dialog for CMYK and RGB images A. Default orientation of CMYK tonal output bar B. CMYK Input and Output values in percentages C. Default orientation of CMYK tonal input bar D. Default orientation of RGB tonal output bar E. RGB Input and Output values are in intensity levels F. Default orientation of RGB tonal input bar
To open the Curves dialog box:
- Do one of the following:
- Choose Image > Adjustments > Curves.
- Choose Layer > New Adjustment Layer > Curves. Click OK in the New Layer dialog box.
- To make the Curves grid finer, hold down Alt (Windows) or Option (Mac OS), and click the grid. Alt/Option-click again to make the grid larger.