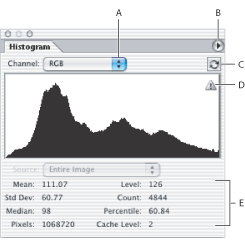
About the Histogram palette
- Choose Expanded View to view the histogram with statistics, and access controls for choosing the channel represented by the histogram, viewing options in the Histogram palette, refreshing the histogram to display uncached data, and choosing a specific layer in a multi-layered document.
- Choose Compact View to display a histogram with no controls or statistics. The histogram represents the entire image.
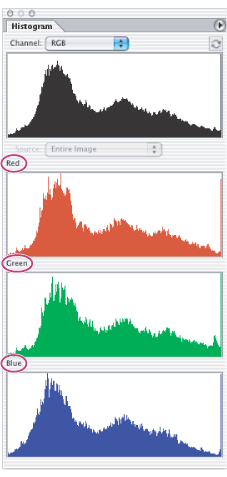
- Choose All Channels View to display individual histograms of the channels in addition to all the options of the Expanded View. The individual histograms do not include alpha channels, spot channels, or masks.
- Choose an individual channel to display a histogram of the document's individual channels including color channels, alpha channels, and spot channels.
- Depending on the image's color mode, choose RGB, CMYK, or Composite to view a composite histogram of all the channels. This is the default view when first choosing Expanded View or All Channels View.
- If the image is RGB or CMYK, choose Luminosity to display a histogram representing the luminance or intensity values of the composite channel.
- If the image is RGB or CMYK, choose Colors to display a composite histogram of the individual color channels in color.
- In the All Channels View, choose Show Channels in Color from the palette menu.
- In Expanded View or All Channels View, choose an individual channel from the Channel menu and choose Show Channels in Color from the palette menu. Switching to Compact View will continue to show the individual channel in color.
- In Expanded View or All Channels View, choose Colors from the Channel menu to show a composite histogram of the channels in color. Switching to Compact View will continue to show the composite histogram in color.
- Choose Entire Image to display a histogram of the entire image including all layers in the multilayered document.
- Choose Selected Layer to display a histogram of the layer that's selected in the Layers palette.
- Choose Adjustment Composite to display a histogram of an adjustment layer selected in the Layers palette, including all the layers below the adjustment layer.
- Double-click anywhere in a histogram.
- Click the Cached Data Warning icon
 .
. - Click the Uncached Refresh button
 .
. - Choose Uncached Refresh from the Histogram palette menu.
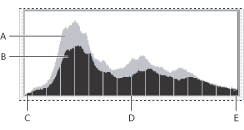
The Histogram palette offers many options for viewing tonal and color information about an image. By default, the histogram displays the tonal range of the entire image. To display histogram data for a portion of the image, first select that portion.
Opening the Histogram palette
Choose Window > Histogram or click the Histogram tab to open the Histogram palette. By default, the Histogram palette opens in Compact View with no controls or statistics. See the following section to learn how to show the Histogram palette in different views.

Adjusting the view of the Histogram palette
Choose one of the following views from the palette menu.

Viewing a specific channel
If you chose the Expanded View or All Channels View, you can choose a setting from the Channel menu. The setting you choose will be remembered and displayed if you switch from either Expanded View or All Channels View back to Compact View.
In the All Channels View, choosing from the Channels menu only affects the topmost histogram in the palette.
Viewing channels in color
To view channels in color, do one of the following:
Showing and hiding statistics
By default, statistics are displayed in the Expanded View and All Channels View. To hide the statistics, make sure Show Statistics is not chosen in the Histogram palette menu. For more information on statistics in the Histogram palette, see Viewing statistical information about pixel values.
Viewing specific statistics
You can place the pointer in the histogram to view information about a specific pixel value. To view information about a range of values, drag in the histogram to highlight the range. For more information on statistics in the Histogram palette, see Viewing statistical information about pixel values.
Viewing options for multilayered documents
If your document is multilayered, you can choose a setting from the Source menu. The Source menu is not available for single-layered documents.
Previewing adjustments
If the Preview option is selected in the dialog boxes of adjustment commands, the Histogram palette displays a preview of how the adjustment affects the histogram.

Refreshing the histogram display
When a histogram is being read from a cache instead of the document's current state, the Cached Data Warning icon ![]() appears in the Histogram palette. Using the image cache, the histogram displays faster and is based on a representative sampling of pixels in the image. This option is enabled and the cache level (from 2 to 8) is specified in the Memory and Image Cache Preference. To refresh the histogram so it displays all of the pixels of the original image in its current state, do one of the following:
appears in the Histogram palette. Using the image cache, the histogram displays faster and is based on a representative sampling of pixels in the image. This option is enabled and the cache level (from 2 to 8) is specified in the Memory and Image Cache Preference. To refresh the histogram so it displays all of the pixels of the original image in its current state, do one of the following:
For information about cache level, see Viewing statistical information about pixel values.